
NM-8 | Update 2016
Corn Stalk Nitrate Test
By Dr. Patricia Steinhilber and Dr. Joshua McGrath
Introduction

The Corn Stalk Nitrate Test (CSNT) is an end-of-season test that provides a retrospective assessment of the season’s nitrogen management, answering the question “Did the corn have too much nitrogen this year?” Corn plants show no visual evidence of over fertilization; therefore, the CSNT can provide this valuable information, allowing producers to know when a field received more nitrogen than needed for maximum yield. After a few years of collecting CSNT data producers can adapt their nitrogen management strategy to increase efficiency and profitability.
How Does the CSNT Work?
Nitrate-nitrogen is mobile within a plant, which means it can move from one part of a plant to another. After pollination, nitrate-nitrogen from the plant leaves and stalk is mobilized and transported into the developing grain. If more nitrogen is available to the plant than needed for maximum yield, nitrate-nitrogen accumulates in the stalk, particularly the lower stalk.
When are Samples Collected?

When using the CSNT for a corn grain crop, samples should be collected:
- from one to three weeks after 80% of the kernels on most ears are at black layer, typically late August to late October.
When using the CSNT for a corn silage crop, samples should be collected:
- just before harvest.
What is Black Layer and How Can It Be Identified?
When corn grain reaches physiological maturity, a black layer forms at the base of each kernel. The black layer is composed of a waxy material that seals off the kernel from further transport of nutrients and water.
If you slice a kernel or chip at its base, the black layer is obvious (Figure 1).
How are Samples Collected?
Follow the steps in Table 1 below to collect samples for the CSNT.
| STEP | ACTION |
|---|---|
| 1 | Collect one (1) representative sample per management unit. |
| 2 | Follow an unbiased sample pattern similar to the collection of soil samples (Figure 2). 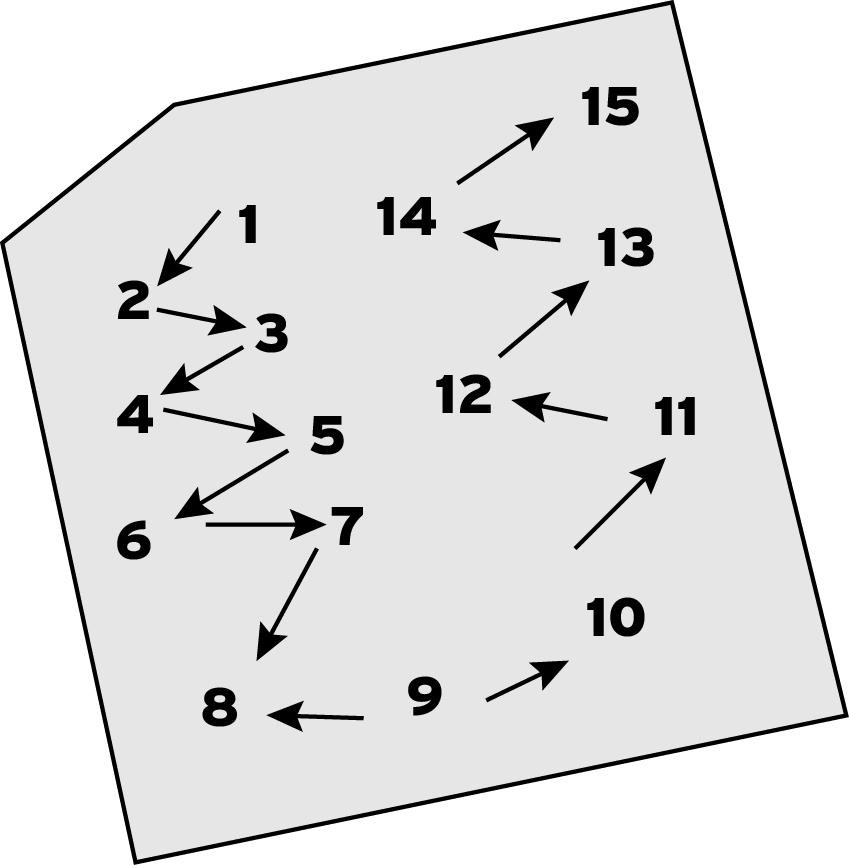
|
| 3 | Collect at least 15 representative stalk samples per management area. The stalks should be collected from 6” above the soil surface and 8” long. (Note: Avoid diseased stalks, stalks with shriveled ears and stalks with serious insect infestation.) 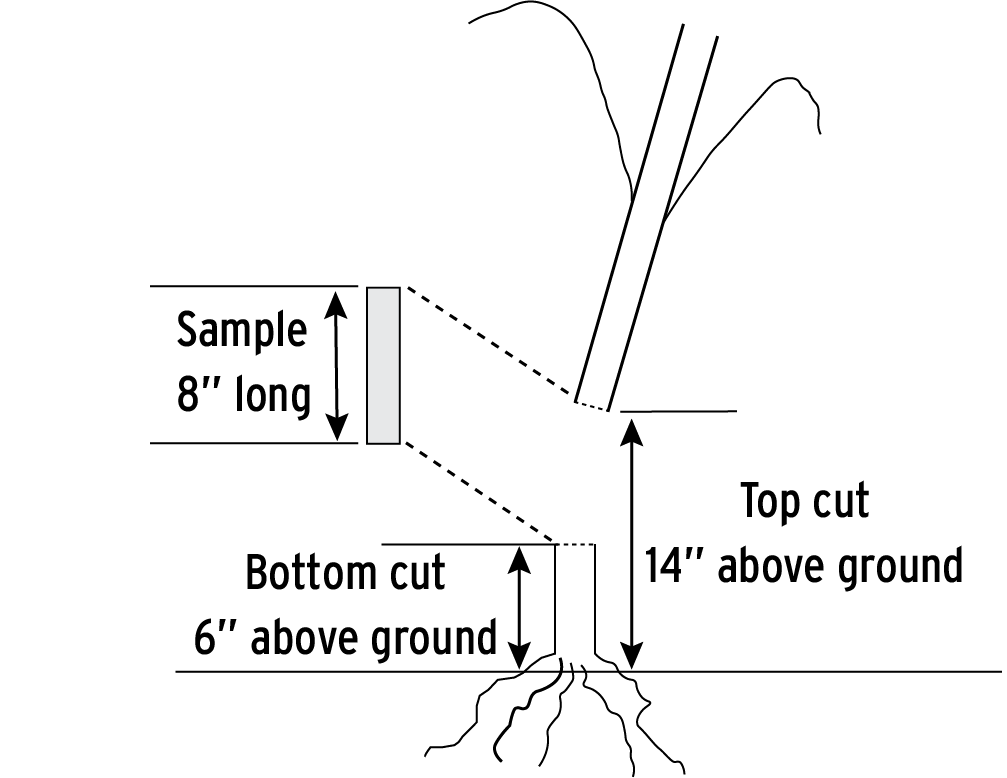
|
| 4 | Remove leaf sheaths. |
| 5 | Cut stalks in 2-inch pieces. |
| 6 | If possible samples should be rapidly air-dried (not oven dried) prior to shipping. Otherwise samples should be placed in a paper bag and shipped to the lab as soon as possible. Do not use plastic or airtight containers as this will encourage molding, which severely interferes with test results. |
What Labs Offer Analysis?
As more producers become interested in the CSNT, agricultural testing laboratories are adding it to list of available tests. Contact your lab of choice and ask about the test.
CSNT Interpretation
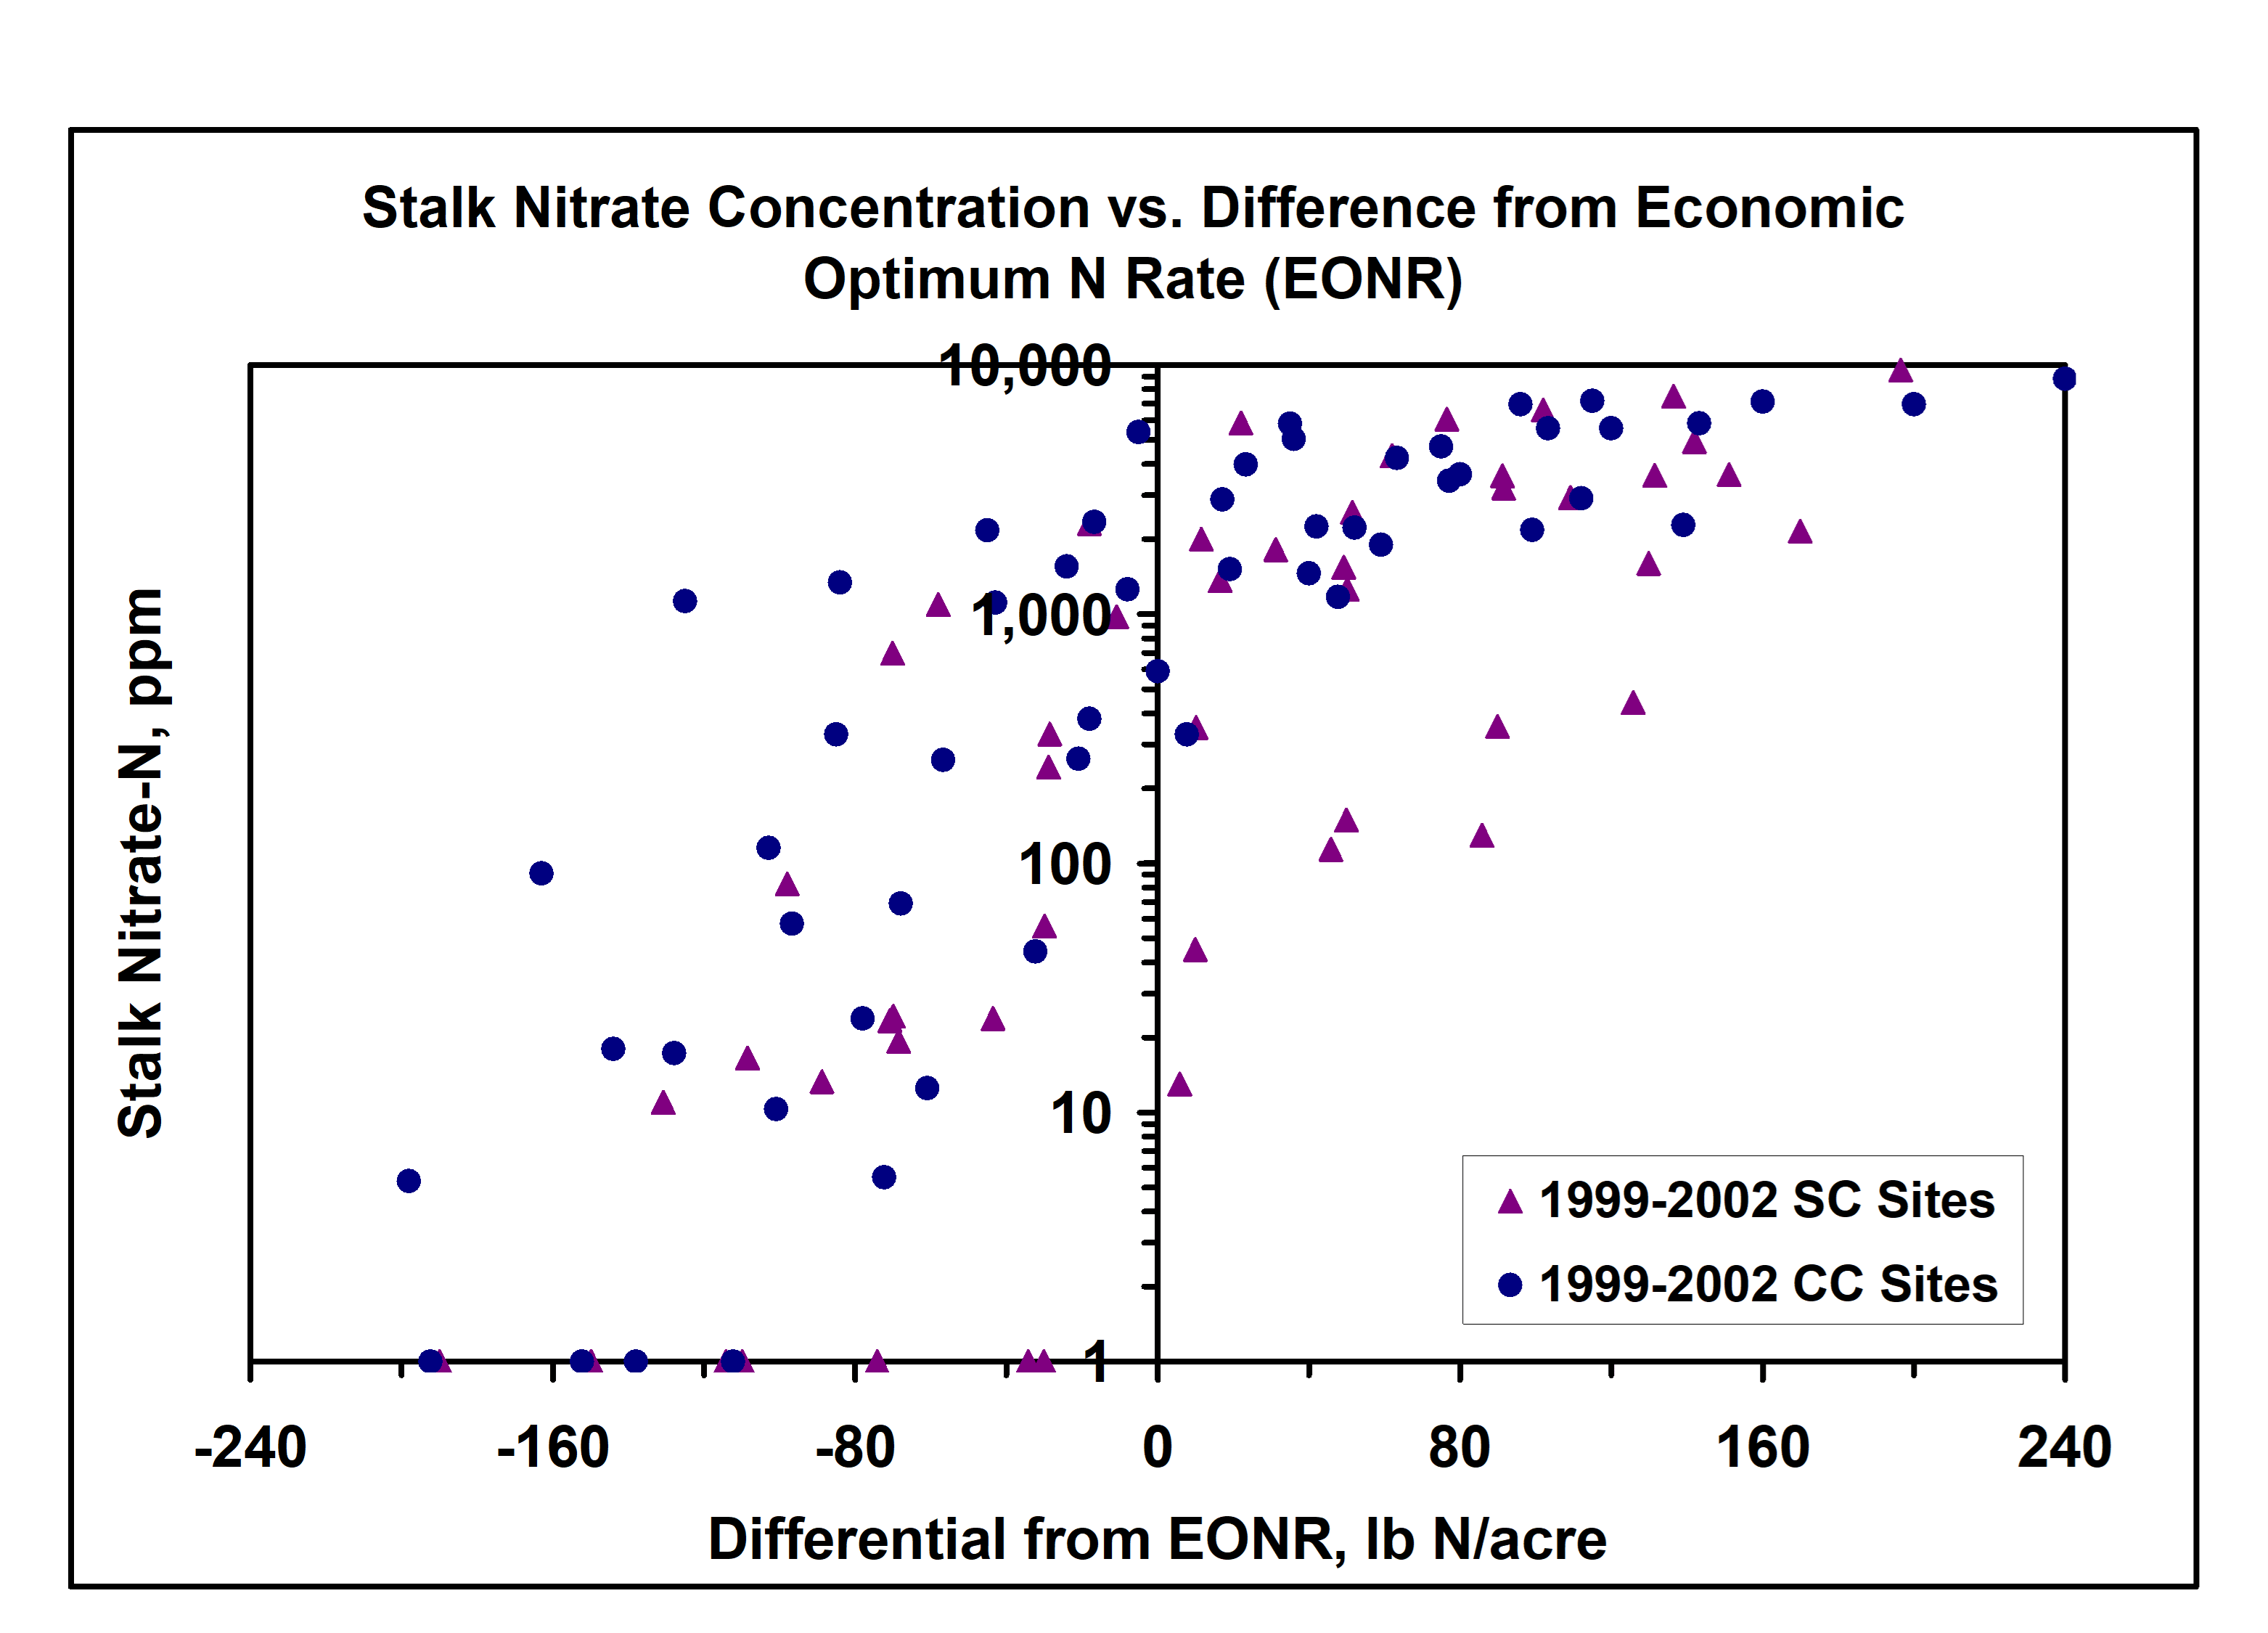
Stalk nitrate levels of 2,000 parts per million (ppm) or higher are considered “excess.” This means that the nitrogen application rate could have been reduced with no loss of yield in that particular year. While some states use CSNT to determine if the N supply was optimal, marginal or deficient, recent research data indicate that this approach is risky. While stalk nitrate levels greater than 2,000 ppm indicate excessive N availability in a very high percentage of instances, stalk nitrate levels below 2,000 ppm are poorly correlated with nitrogen status or yield. Data from Dr. John Sawyer’s research in Iowa (Figure 4, above) clearly demonstrates the wide range of nitrogen adequacy at specific nitrate concentrations below 2,000 ppm. Figure 4 shows that stalk nitrate concentrations below 2,000 ppm can occur across a wide range of N application rates. However, almost all of the very high stalk nitrate concentrations occurred when the N rate was greater than the EONR.
Responding to “Excess” CSNT
If using fertilizer N only and yields met or exceeded your expectations, then
- ensure that the yield goal used to develop the current year’s nutrient management plan was actually based on long-term yields in the field.
If using manure and yields met or exceeded your expectations, then
- collect a representative manure sample at least yearly to confirm that the manure application rate is based on accurate information; and
- re-calibrate the manure spreader to ensure recommended application rate is applied.
After 3 – 5 years of “excess” CSNT and meeting the above conditions, discuss reducing your nitrogen rate with your nutrient management planner.
When is the CSNT Not Useful?
In situations where yield was limited in a field, excess stalk nitrate would be expected, but would not be reflective of nitrogen management. Examples of such situations are
- drought years; and
- fields with serious and widespread disease or insect incidence.
References
Binford, G. D., A. M. Blackmer, and N. M. El-Hout. 1990. Tissue test for excess nitrogen during corn production. Agron. J. 82:124-129.
Sawyer, J. 2010. Cornstalk Nitrate Interpretation. Integrated Crop Management, 9-14-10, Iowa State University. http://www.extension.iastate.edu/CropNews/2010/0914sawyer.htm
Woli, K.P, S. Rakshit, J.P. Lundvall, J.E. Sawyer, and D. Barker. 2013. On-farm evaluation of liquid swine manure as a nitrogen source for corn production. Agron. J. 105:248-262.
Original publication date: September 2008 as NM-8
PATRICIA STEINHILBER
psteinhi@umd.edu
JOSHUA MCGRATH
josh.mcgrath@uky.edu
This publication, Corn Stalk Nitrate Test (NM-8), is a part of a collection produced by the University of Maryland Extension within the College of Agriculture and Natural Resources.
The information presented has met UME peer-review standards, including internal and external technical review. For help accessing this or any UME publication contact: itaccessibility@umd.edu
For more information on this and other topics, visit the University of Maryland Extension website at extension.umd.edu
University programs, activities, and facilities are available to all without regard to race, color, sex, gender identity or expression, sexual orientation, marital status, age, national origin, political affiliation, physical or mental disability, religion, protected veteran status, genetic information, personal appearance, or any other legally protected class.
When citing this publication, please use the suggested format:
Steinhilber, P., & McGrath, J. (updated 2016 | 2008). Corn Stalk Nitrate Test (NM-8). University of Maryland Extension. go.umd.edu/NM-8